Work / case study 01
RinkView
Shot quality, matchups and lineup decisions for a full NHL season, with the uncertainty kept on screen.
- 1,312games, the whole 2025-26 season
- 32teams, no club hard-wired
- 940skaters, every one evaluable
- 112,058shots the xG model is fitted on
The problem
Questions like was that a good shot or who should play with whom usually get answered with raw counts and gut feel. Small samples lie, and most tools hide that behind a confident-looking number. RinkView is a decision-support app for hockey-operations staff that shows the number and how much to trust it, for any of the 32 clubs. First run asks which team you work with, and that choice drives every page.
What it does
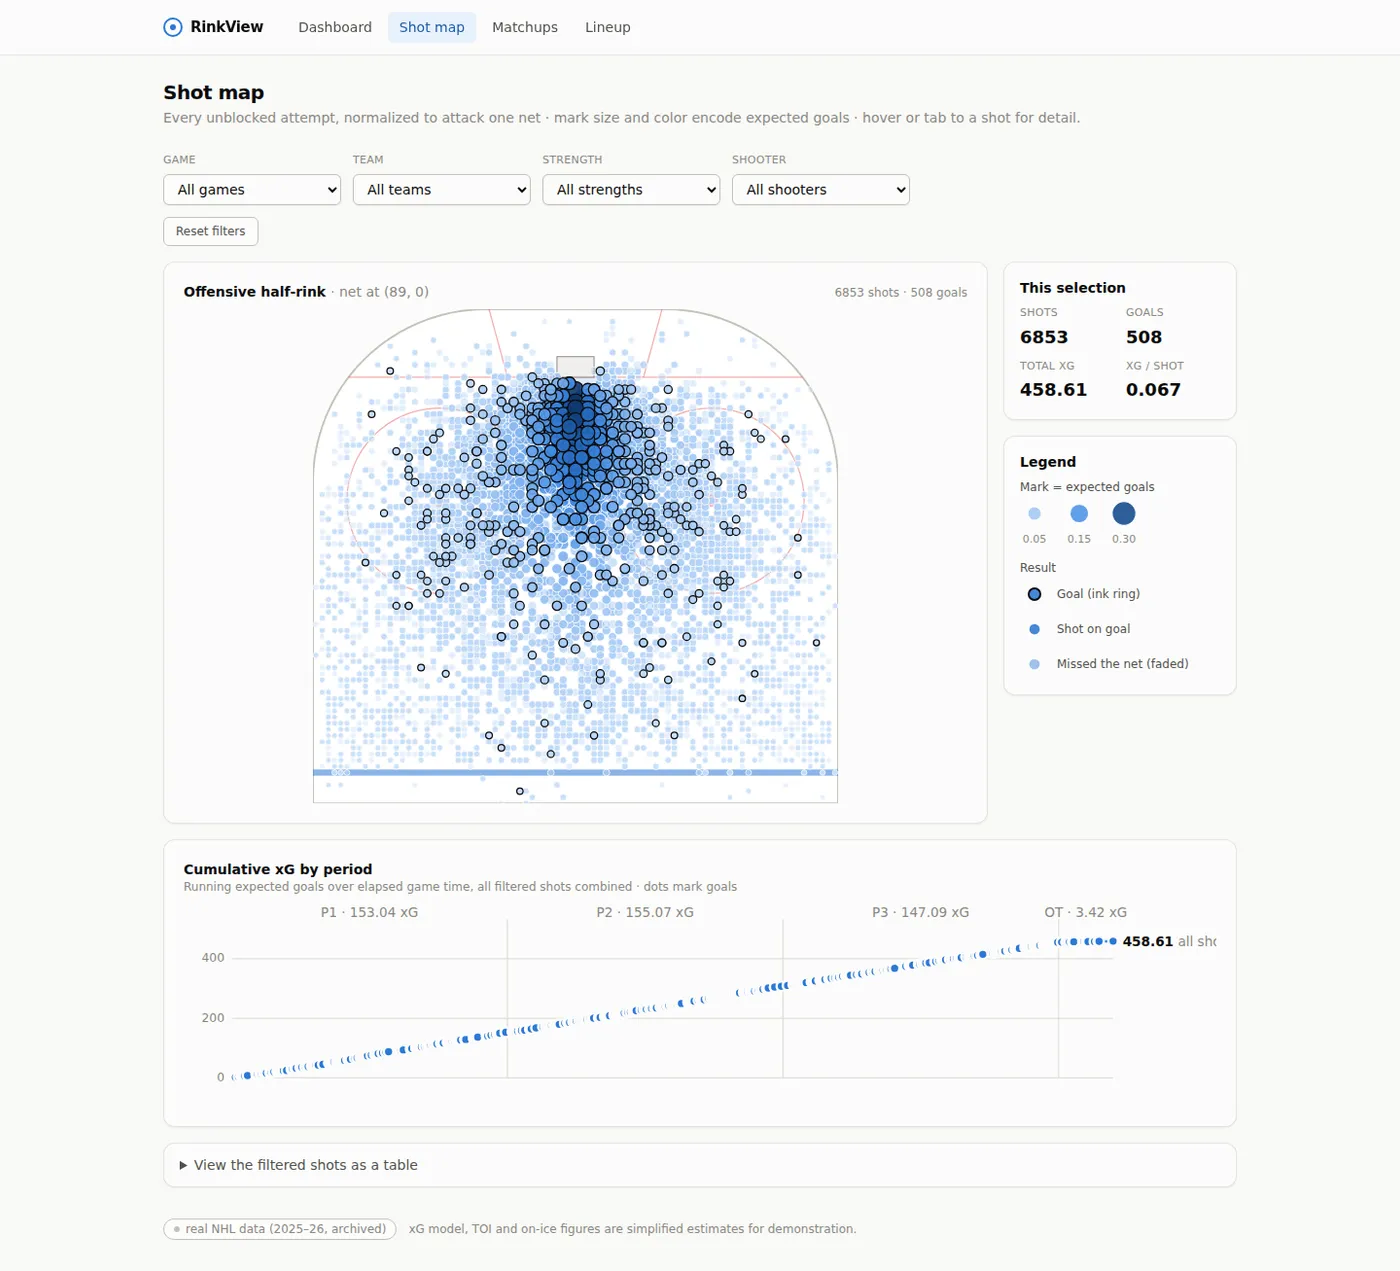
- Shot maps with an expected-goals overlay. Every unblocked attempt of the season on one half-rink, filterable by game, team, strength, shooter, period, result and danger.
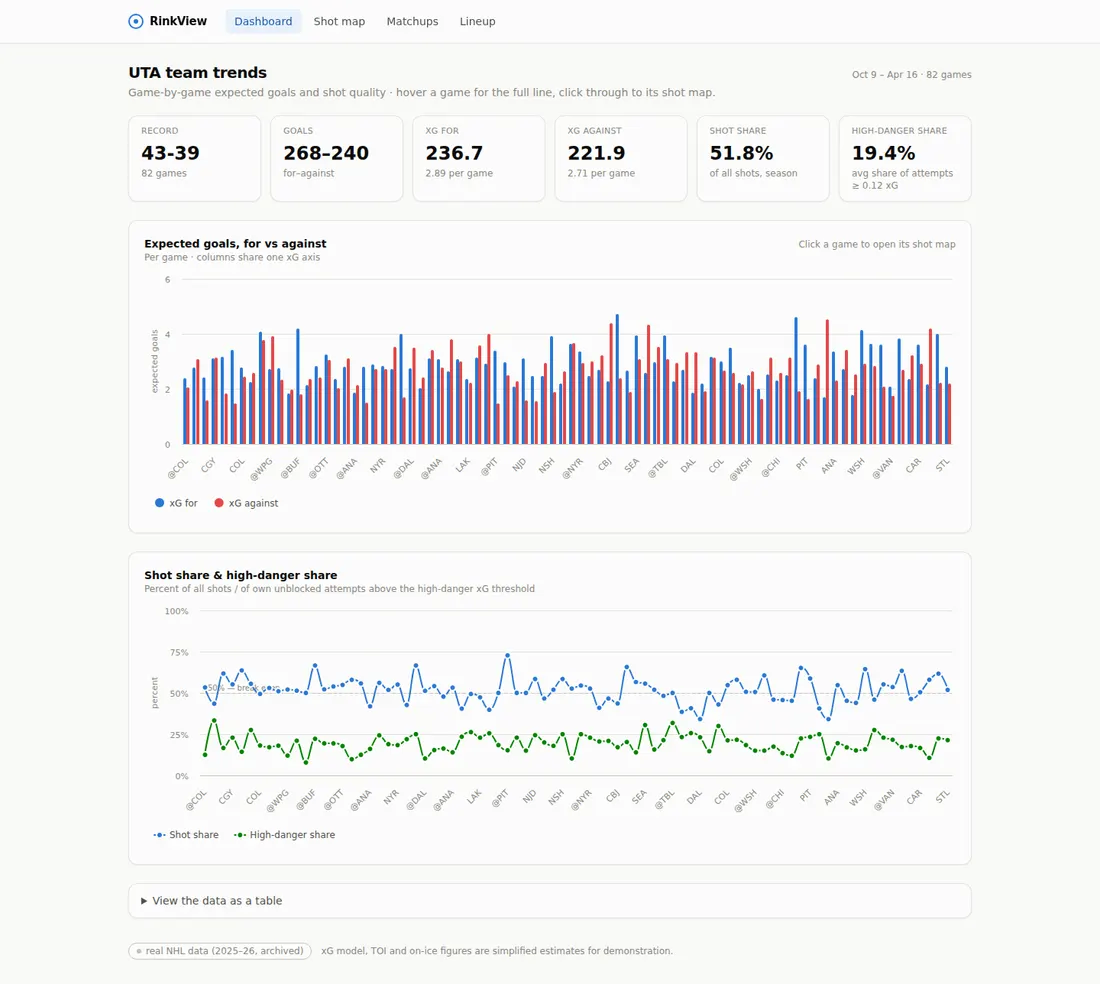
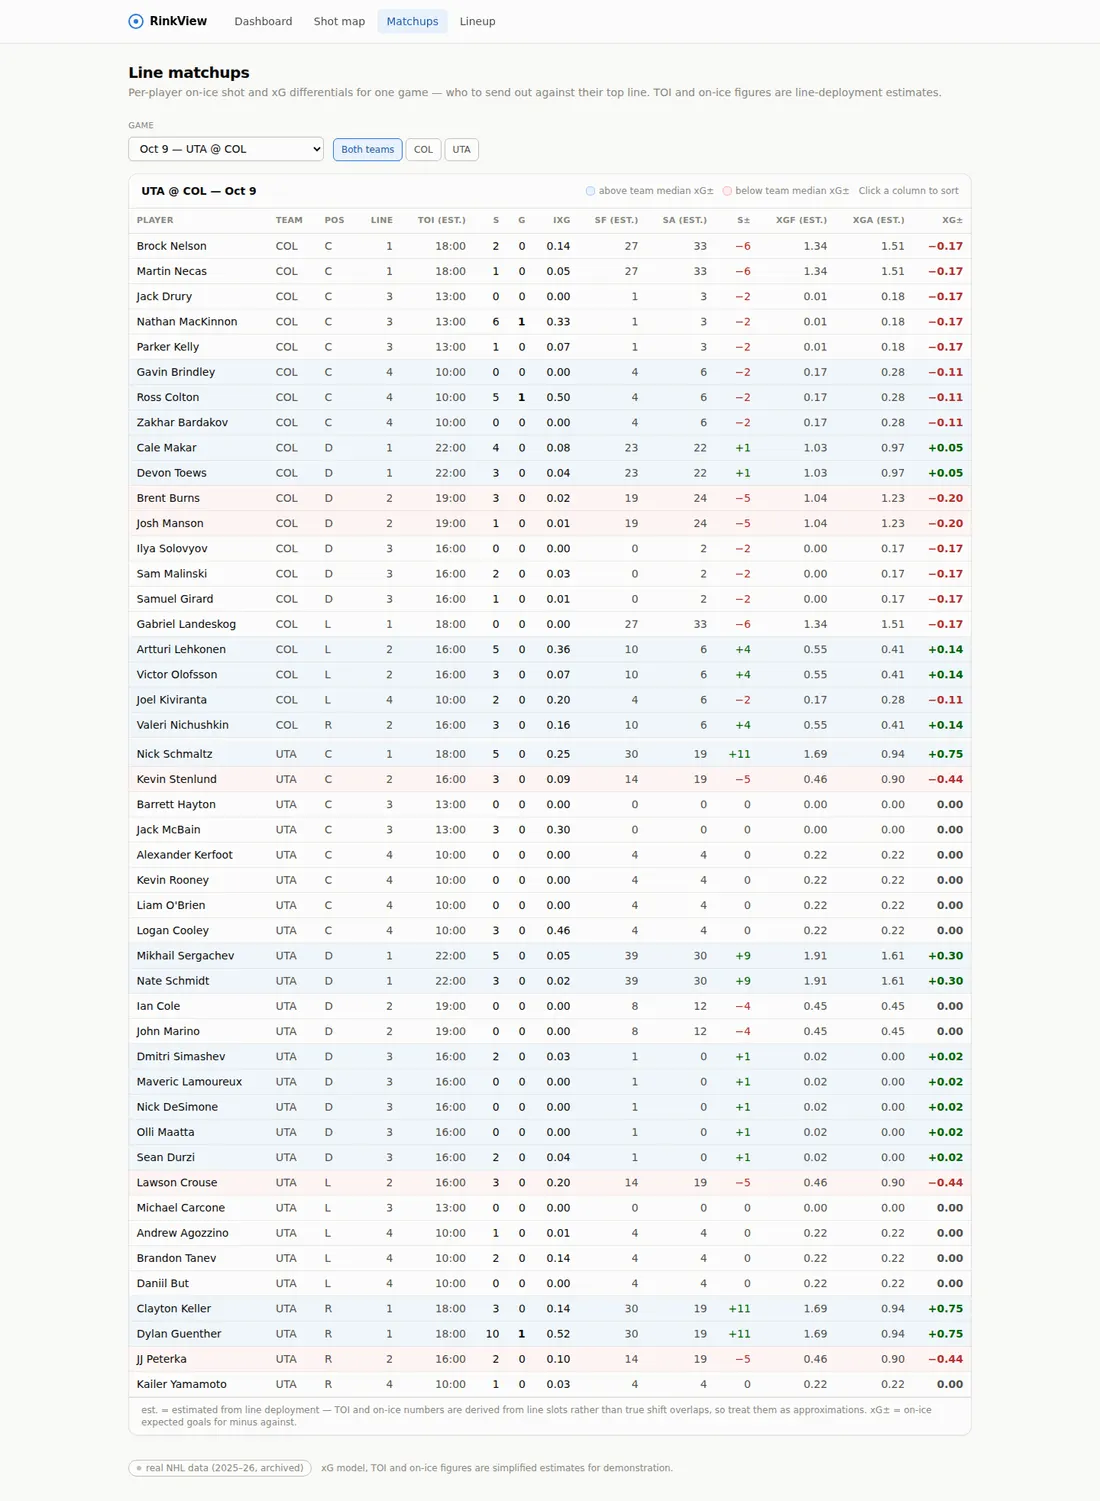
- Team shot-quality trends per game across a season segment, and a per-player matchup table built from true shift overlaps rather than line-slot guesses.
- A trade and lineup evaluator for every skater in the league: on-ice results together and apart, pair matrices, trade-out and slot-swap scenarios, and cross-team trade-ins rated on the player’s own minutes. Chemistry with new linemates is shown as an explicit unknown, never a number.
- Ask RinkView, a chat over the dataset with one rule: the model is never the source of a number. Every figure comes from a visible, read-only tool call. It is provider-agnostic across Anthropic, OpenAI and Gemini, and a visitor can bring their own key.
How it is built
Django and Pandas serve a read-only JSON API over SQLite. A thin Next.js shell mounts framework-free D3 and Highcharts modules, so the chart engine has no React in it and is unit-tested on its own with Node’s built-in runner.
The expected-goals model is a two-feature logistic regression (distance and angle) fitted by maximum likelihood on the whole league. Richer variants were tried and deliberately not shipped because they made top-decile calibration worse; the report says so, with the numbers.
On-ice rates use empirical-Bayes shrinkage with a league-pooled shrinkage parameter, server-enforced sample floors and bootstrap uncertainty bands. The evaluator never claims a causal player effect, and every statistical choice has a written defense in the repo, including the follow-up question I would expect across an interview table and the answer I would give.
Deployment is one stateless container: the database is baked into the image at build time, the frontend is a static export served from the same origin as the API, and CI-green commits deploy automatically to Google Cloud Run through keyless GitHub Actions. Scale-to-zero, so the first load after a quiet spell takes a few seconds.
How it was made
Solo, and fast, running an AI-assisted workflow end to end: I scoped each pass, directed it, reviewed the result and verified it against the real data before it shipped. The design of the lineup evaluator went through a planner, a devil’s advocate and a gatekeeper before any code, and the critique forced a rescope that the repo documents rather than hides. That paper trail is part of the product.
What I would do next
Pre-shot context for the xG model on multi-season data, authentication and roles before it touches anything proprietary, Postgres instead of SQLite once there are concurrent users, and a scheduled ingest of new games instead of a one-shot command.